
#AgCensus and MyPlate Serve up Lessons in Math, Nutrition, and More

Posted by Krissy Young, Public Affairs Specialist, National Agricultural Statistics Service in Food and Nutrition Research and Science
Aug 05, 2014
Map includes the following commonly eaten grains: oats, popcorn, rice, rye, wheat. Source: 2012 Census of Agriculture. Click to enlarge.

This post is part of the Science Tuesday feature series on the USDA blog. Check back each week as we showcase stories and news from the USDA’s rich science and research portfolio.

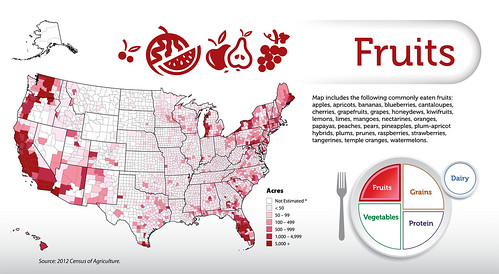
Where was the food on your plate grown? Do you know in which state the apple in your lunchbox was mostly likely harvested? Or where the milk from your milk carton was mostly likely produced?

USDA’s National Agricultural Statistics Service (NASS) is helping students, parents, and teachers get revved up for a healthy school year by exploring U.S. agriculture production and the food they eat. Using the maps to display learning the most recent Census of Agriculture results, NASS is showing where foods in the five main food groups, dairy, fruits, grains, proteins, and vegetables, according to USDA’s MyPlate, are grown in the United States.  And the conversation and learning opportunities continue online using the hashtag #AgCensus.

Linking Census of Agriculture data and MyPlate, this tool serves up several helpings of development opportunities for educators and students by bringing lessons in agriculture, nutrition, math, science, and geography into the classroom. From farm to fork, you can explore what most commonly eaten foods are grown right in your own state and county.

Map includes the following commonly eaten vegetables: artichokes, asparagus, avocados, bell peppers, green lima beans, snap beans, beets, broccoli, Brussels sprouts, cabbages, carrots, cauliflowers, celery, cucumbers, pickles, eggplant, escaroles, endives, lettuce, okra, onions, peas, potatoes, pumpkins, spinach, squash, sweet corn, sweet potatoes, tomatoes, turnips and watercress. Source: 2012 Census of Agriculture. Click to enlarge.

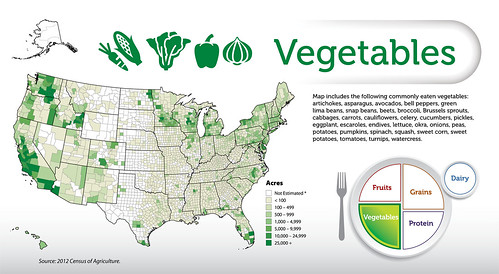
For example, did you know that out of the five main MyPlate food groups, “vegetables” is the primary food group that should take up the most room on your plate? Can you add up the acres of vegetables in your state to estimate the total acres harvested locally in 2012? And do you know which state had the most harvested acres in vegetables according to the Census? Why do you think this state grows more vegetables than any other state in the United States? Perhaps weather? Terrain? Anything else?

Map includes the following commonly eaten proteins: chickens, cattle and calves, ducks, geese, hogs, sheep and lambs, turkeys, eggs, lentils, almonds, hazelnuts, macadamia nuts, peanuts, pecans, pistachios, sunflower seeds, walnuts, catfish, trout, other food fish. Source: 2012 Census of Agriculture. Click to enlarge.

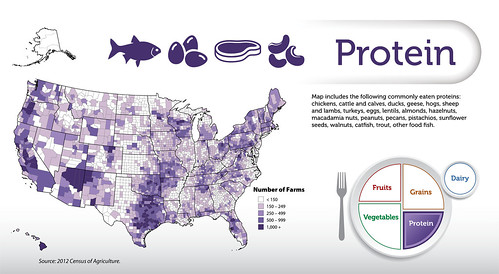
Let’s explore the other side of your plate for a balanced diet with proteins. Do you know that proteins, while a much smaller portion of your plate, can be found on farms in all 50 states? This includes farms that produce food such as chicken, beef, eggs, fish, and nuts. Which county closest to you has farms producing some type of protein?  Are there any farms in your own county? Perhaps a field trip or visit from a farmer can be explored this school year to get an even closer look!

Map includes the following commonly eaten fruits: apples, apricots, bananas, blueberries, cantaloupes, cherries, grapefruits, grapes, honeydews, kiwifruits, lemons, limes, mangoes, nectarines, oranges, papayas, peaches, pears, pineapples, plum-apricot hybrids, plums, peaches, prunes, raspberries, strawberries, tangerines, temple oranges and watermelons. Source: 2012 Census of Agriculture. Click to enlarge.

Learning about the food we eat and how it is produced is fundamental to building a healthy and informed future generation. Understanding what should be on your plate through MyPlate will increase enthusiasm for healthy eating and help build strong minds and bodies.  And learning more about where the food on your plate comes through #AgCensus will increase appreciation for agriculture, the farmers who help feed us, and bring new math and science opportunities into the classroom.

So this school year, whether you serve it up or dish it out, bring new lessons in agriculture, math, nutrition, and more into the classroom with the #AgCensus and MyPlate!

Map includes the following commonly eaten dairy item: milk. Source: 2012 Census of Agriculture.  Click to enlarge.
Map includes the following commonly eaten dairy item: milk. Source: 2012 Census of Agriculture. Click to enlarge.