All this month we will be taking a look at what a changing climate means to Agriculture. The ten regional USDA Climate Hubs were established to synthesize and translate climate science and research into easily understood products and tools that land managers can use to make climate-informed decisions. The Hubs work at the regional level with an extensive network of trusted USDA agency partners, technical service providers, University collaborators, and private sector advisers to ensure they have the information they need to respond to producers that are dealing with the effects of a variable climate. USDA's Climate Hubs are part of our broad commitment to developing the next generation of climate solutions, so that our agricultural leaders have the modern technologies and tools they need to adapt and succeed in the face of a changing climate.
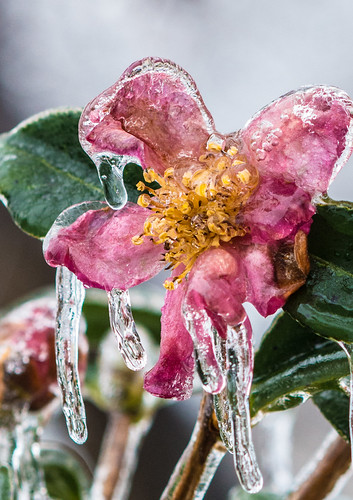
You might have noticed spring-like weather in the Northeast is arriving earlier than usual. There is reliable evidence from many studies that conditions in the Northeast and upper Midwest have become warmer and wetter in recent decades, especially before the coming of winter and spring. The spring-like warmth has snow melting faster and plant growth starting sooner. On average, the last spring frost in the Northeast is about a week earlier now than it was 30 years ago. The change is not as positive as one might expect since the start of growth for many plants has shifted even earlier than the last frost date leading to increased chances of frost damage. This happens most often when unusually warm temperatures in March are followed within 2-5 weeks by a frost event. In 2012, record high March temperatures were followed by record low temperatures (for the date) at the end of April with terrible consequences for fruit growers across Michigan, Ontario, New York, Vermont, and surrounding states. In some places losses were almost total. In something of a repeat, unusual warmth in the Northeast this past winter was interrupted by very cold outbreaks in mid-February and early April. This combination was particularly bad for peaches in New Jersey, Connecticut, parts of New York, and other northeastern states where greater than 90% losses have been reported.
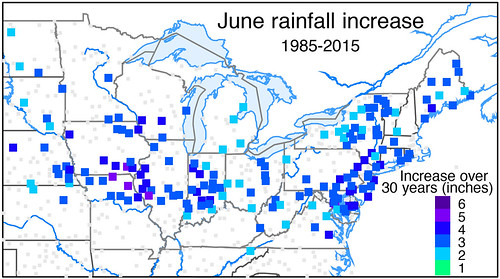
Another trend affecting farmers across the Northeast and much of the Midwest is more rain in June. The symbols on the map show the location of long term weather stations where June rainfall has increased significantly over the last 30 years (nowhere in the northeastern United States has there been a significant decrease in June rain). Much of the Northeast has seen an average June increase of 2 to 4 inches, a big increase, close to double, compared to 30 years ago. However, current June rainfall totals are not unprecedented, as similar accumulations were common in the late 1970s and early 1900s. The result of the extra rain for farmers is a big decrease in the number of days that fields can be worked and increasing problems with blights and disease. The only other months with similar widespread increases in rainfall across this region are December and October, especially in southeastern Pennsylvania, Maryland, and Delaware. November is the one month that has seen a widespread significant decrease in precipitation.
Although it is not clear whether the observed pattern of wet Junes will continue, the National Weather Service's Northeast River Forecast Center reports that springtime in the Northeast is often much wetter than usual as an El Niño fades – right where we are now. Over the longer term, the newest climate model simulations for the Northeast show that June and July will feature the largest monthly increases in rainfall. All of these models agree that the Northeast U.S. will continue to get wetter for the foreseeable future. There are few places anywhere in the world where all of the models line up in this way.
Want more updates like this from the Northeast Climate Hub? Sign up for our Quarterly Newsletter, Follow us on Twitter at @USDAClimateHubs, and please join us on May 18th at 2pm EST for our next webinar, Cornell's Climate Smart Farming Program: Research, Tools, and Extension Support for Farmers in NY and the Northeast.